Half-Life Visualizer & Calculator
See how medication levels rise and fall between injections. Switch compounds, change the dose and schedule, watch the curve respond in real time.
Semaglutide
Half-life 7.0 days·tMax 34h
Population-average pharmacokinetic model. Individual variation is significant. Not medical advice. See the methodology.
This tool is for informational purposes only, so always double-check your result with a healthcare provider. Levels shown are estimates from a population-average pharmacokinetic model, not a dosing recommendation, and individual variation is significant. We assume no liability for dosing errors.
Last updated September 2026 · Reviewed by the Regimen Team
The tool
How it works, what it tells you, what it doesn't.
The half-life visualizer maps the pharmacokinetic curve: how drug levels in your blood peak after injection, then gradually decline until the next dose. Understanding this curve helps you choose an injection frequency, time bloodwork meaningfully, and explain why you feel different at different points in your dosing cycle. Testosterone cypionate (half-life about 6.9 days) produces wider swings on weekly injections than on every-other-day or daily protocols. GLP-1s like semaglutide (half-life around 7 days) are remarkably stable week to week. This calculator uses the same Bateman model the Regimen app uses, calibrated to each compound's published half-life and time-to-peak.
How to use it
How to Use This Visualizer
- 01
Select a compound
Choose from semaglutide, tirzepatide, retatrutide, liraglutide, dulaglutide, testosterone, and HGH
- 02
Enter your dose
The amount you take per administration in mg, mcg, or IU
- 03
Set frequency and start date
How often you dose and when you started your protocol
- 04
View the curve
See blood concentration with peak, steady state, and clearance estimates
How This Visualizer Works
This tool uses the Bateman equation, a one-compartment pharmacokinetic model that accounts for both absorption and elimination phases. Unlike simple exponential decay calculators, the Bateman model creates a realistic curve that starts at zero, rises as the compound absorbs into your bloodstream, peaks at Tmax, and then gradually declines.
When you dose repeatedly, the tool uses superposition to sum the contribution of every previous dose at each point in time. This shows how levels accumulate with consistent dosing and eventually reach a steady state where peak and trough levels stabilize.
The key parameters for each compound are half-life (how quickly the compound is eliminated), Tmax (time to peak absorption), and the absorption rate constant (derived from these values). All parameters are based on published clinical data and FDA prescribing information.
Data Sources
This tool uses dosing information from official prescribing information:
- Semaglutide - FDA NDA 209637 (Ozempic prescribing information), half-life ~7 days
- Tirzepatide - FDA NDA 215866 (Mounjaro prescribing information), half-life ~5 days
- Retatrutide - Phase 2 clinical trial data (Jastreboff et al., NEJM 2023), half-life ~6 days
- Testosterone Cypionate - Published pharmacokinetic literature (PMC5915615, DrugBank), terminal half-life ~6.9 days (166 hours). Enanthate uses the same value.
- BPC-157 - Plasma half-life ~0.4 h (~24 min), animal data (PMC9794587). Not charted: plasma level is a poor proxy for its effect duration.
- TB-500 - Published research literature (Thymosin Beta-4), estimated half-life ~2 hours
- HGH (Somatropin) - FDA-approved prescribing information, half-life ~4 hours
Get the app
See your personal curve in the app
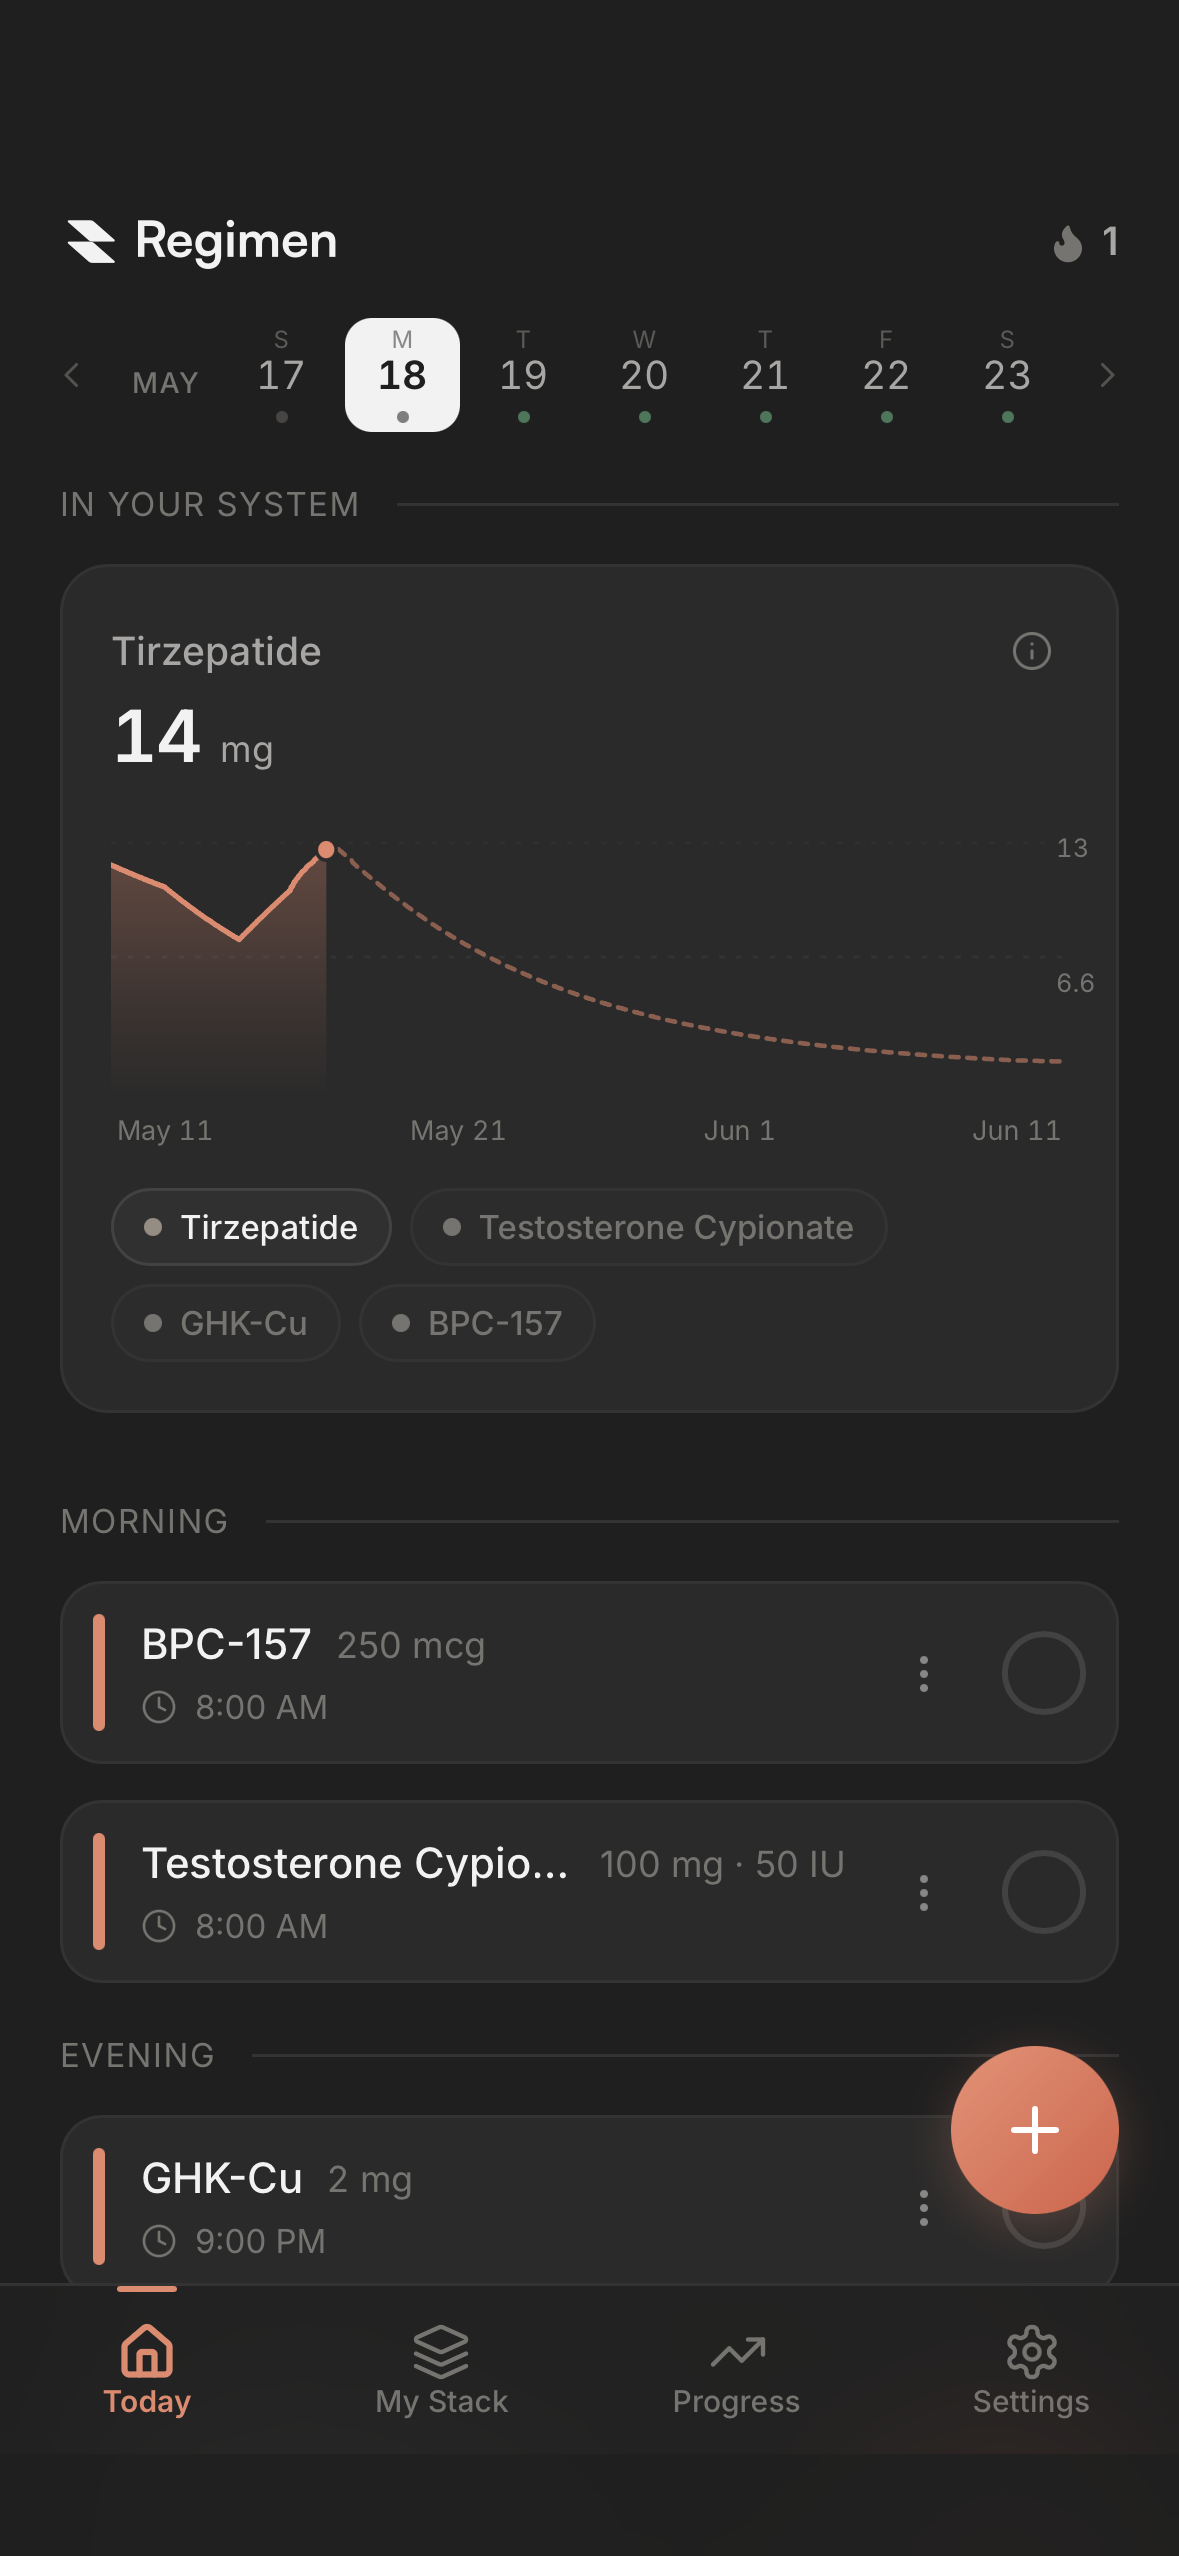
Regimen logs every injection and builds your personal pharmacokinetic curve, with site rotation, lab work tracking, and Apple Health correlation.
- Visualize any compound you're tracking
- See current blood levels and clearance
- Smart injection reminders
- Private, secure health data


Free to download. Free for your first compound.
Questions