Testosterone Enanthate Half-Life Calculator
Test E half life: testosterone enanthate's terminal half-life is about 6.9 days. See how injection frequency changes the peak-to-trough stability of your levels.
Testosterone Enanthate
Half-life 6.9 days·tMax 96h
Population-average pharmacokinetic model. Individual variation is significant. Not medical advice. See the methodology.
This tool is for informational purposes only, so always double-check your result with a healthcare provider. Levels shown are estimates from a population-average pharmacokinetic model, not a dosing recommendation, and individual variation is significant. We assume no liability for dosing errors.
Last updated October 2026 · Reviewed by the Regimen Team
The tool
How it works, what it tells you, what it doesn't.
Testosterone enanthate is a long-ester injectable testosterone with a terminal half-life of about 6.9 days (166 hours). Regimen models enanthate and cypionate at the same value: the two esters are near-identical in practice, and cypionate has the more rigorous measured figure, so anchoring both to it avoids implying a gap that isn't really there. Like other long esters, enanthate follows flip-flop kinetics where the depot release rate is what limits the curve. That produces a slow rise to peak (about 96 hours after injection) and a steady decline. The injection frequency you choose dramatically changes the peak-to-trough swing. Weekly produces wide swings; twice-weekly cuts that in half; daily essentially flattens the curve. This calculator uses the Bateman model with the L'Hôpital limit branch for flip-flop kinetics, matching the Regimen app's PK engine.
How to use it
How to use the testosterone enanthate half-life calculator
- 01
Set your dose
Common TRT doses: 100-200 mg per week split across one to three injections.
- 02
Choose the schedule
Weekly, twice weekly (every 3.5 days), or every 3 days. The schedule changes the curve shape more than the total weekly dose does.
- 03
Set the simulation window
8-12 weeks shows the climb to steady state plus stable oscillation.
- 04
Compare schedules
Run the same dose across weekly vs twice-weekly to see how stability improves.
Worked example: 200 mg/week, weekly vs twice weekly
Testosterone enanthate is an oil-based intramuscular or subcutaneous testosterone ester. The apparent serum half-life after a shot is about 6.9 days, governed by release from the oil depot rather than clearance of free testosterone (flip-flop kinetics). That release-limited rate is short enough that injection frequency still has a meaningful effect on the peak-to-trough variance you experience week to week.
Take a 200 mg per week protocol. Injected as a single weekly dose (200 mg on Monday), the curve climbs into a peak around day 2 to 3, then declines steadily across the following 4 to 5 days. The trough just before the next injection sits well below the peak, and the calculator above shows the exact ratio for your dose. That swing is what some users experience as a “low ebb” in the second half of the week.
Split the same 200 mg into two 100 mg injections (Monday and Thursday), and the curve compresses meaningfully. Peaks are lower, troughs are higher, and the trough-to-peak ratio rises substantially. The calculator plots both patterns side by side. Lower peaks mean less aromatization to estradiol from supraphysiological spikes. Higher troughs mean less symptomatic variance. This is why most modern TRT protocols default to twice-weekly injection at minimum, and some go to every-other-day or daily microdose protocols for the flattest possible levels.
Test E vs test C: are they actually different?
Practically, no. Testosterone enanthate and cypionate are near-identical esters, and both carry an apparent serum half-life of about 6.9 days, so the curve you see after a shot behaves the same way. You will sometimes see enanthate quoted around 4.5 days and cypionate around 8 days, but those older textbook figures imply a gap that does not hold up: the two are dosed interchangeably and clear the blood on essentially the same timeline. We anchor both to the rigorous measured pharmacokinetic data, which lands at about 6.9 days. So the same twice-weekly-vs-weekly math applies to either ester.
For dose math, open the TRT injection calculator. For a deeper dive into daily microdosing math, read the daily TRT insulin syringe dose guide.
Get the app
See your real testosterone curve in the app
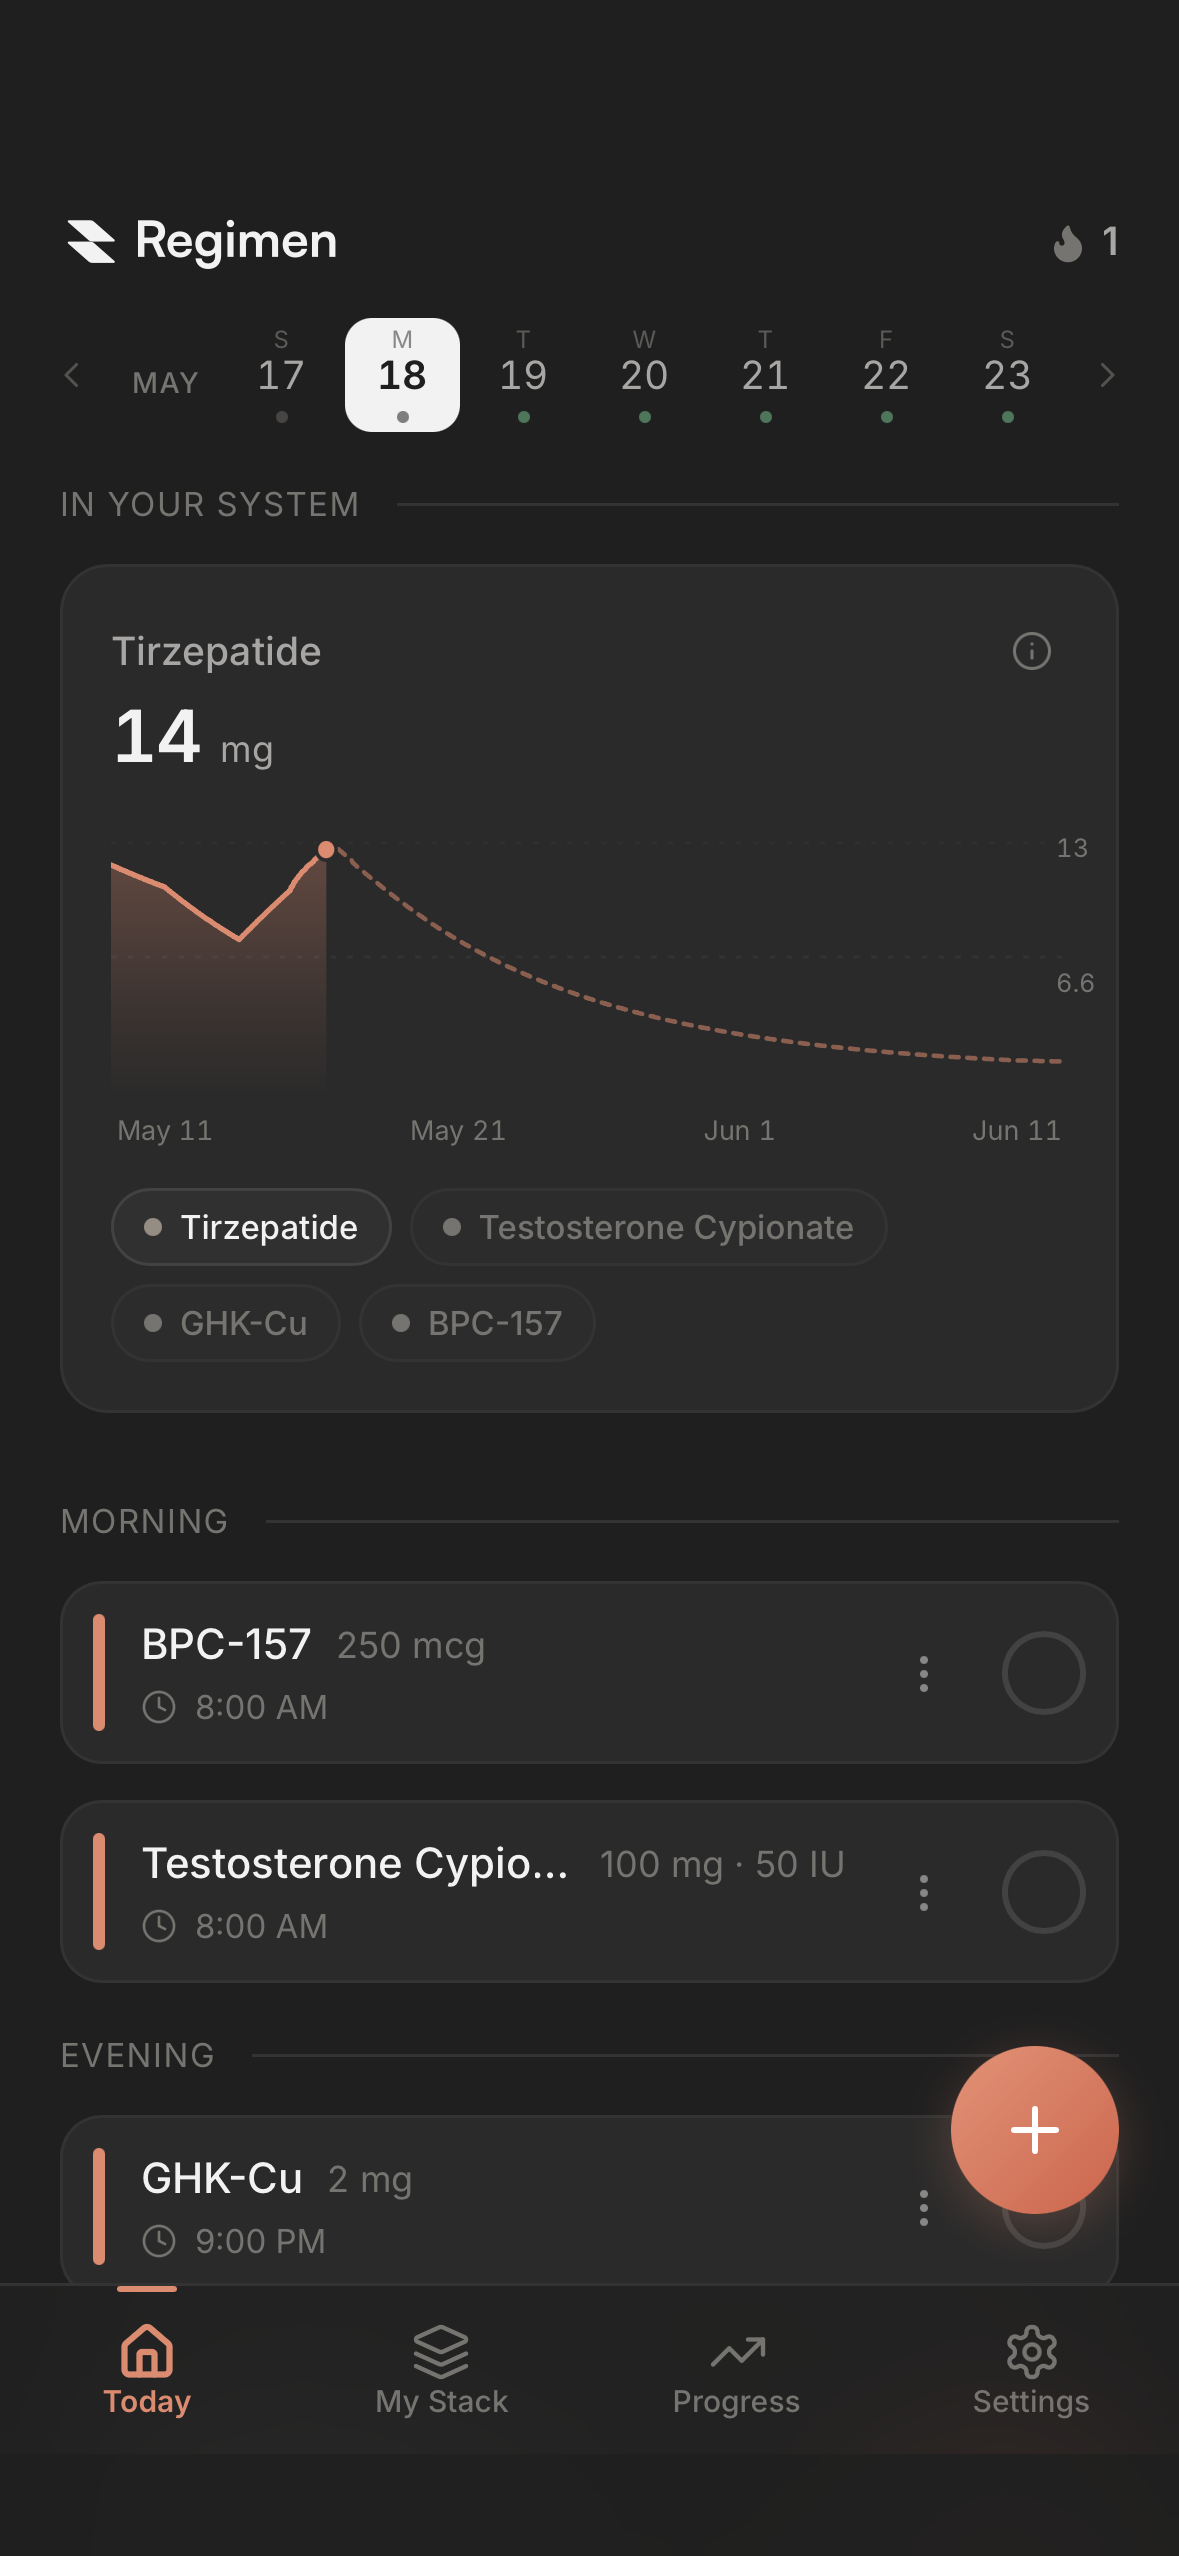
Regimen logs each TRT injection, builds your personal active-level curve, and correlates dose changes with bloodwork over time.
- Personalized PK curves
- Twice-weekly injection reminders
- Symptom and lab correlation
- Private, secure health data


Free to download. Free for your first compound.
Questions